
The first time OrcaSlicer ate my afternoon, I’d clicked Slice Plate on a 600,000-triangle dragon and watched the window vanish without so much as an error dialog. No log popup, no Windows toast, nothing. I opened it again, loaded the same model, and watched it do the same trick.
That was Issue #8227, and once I’d traced it to my i9’s E-cores I started keeping a list. Different OS, different cause, but the same maddening pattern: you press the big button, OrcaSlicer dies, and the fix depends almost entirely on your platform. This walks through eight specific crash patterns I’ve debugged across Windows, macOS, and Linux, each tied to a tracked GitHub issue you can verify yourself.
Table of contents
- Why OrcaSlicer crashes when you click Slice Plate
- First step: find your crash log
- Fix 1: Windows + Intel E-core crash on complex models (#8227)
- Fix 2: Linux 75% freeze + OOM (#9094)
- Fix 3: Windows 11 + 2.3.2 takes 90 seconds to open (#13239)
- Fix 4: Large-file GPU crash on import (#12142)
- Fix 5: macOS crashes on slice or launch
- Fix 6: Organic tree supports that look frozen (#9064)
- Fix 7: Re-slice slowdown after layer-height change (#9397)
- Fix 8: Windows Defender blocks the 2.3.2 installer (#12923)
- Diagnosing RAM without inventing minimums
- When to file a bug report
- FAQ
Why OrcaSlicer crashes when you click Slice Plate
Before you start chasing fixes, you need to know which failure mode you’re actually looking at, because the three big categories don’t share a root cause and they don’t share a workaround.
Hard crash vs freeze vs OOM
A hard crash is the one I described in the intro: the OrcaSlicer window disappears, sometimes with a generic “OrcaSlicer.exe has stopped working” toast, sometimes without anything at all. On Windows that’s overwhelmingly Intel hybrid-CPU E-core scheduling on dense models (Issue #8227). On 2.3.2, certain cylinder and torus geometries reproduce a similar hard crash per Issue #12906.
A freeze looks different. The progress bar climbs, hits roughly 75 percent, and then the app locks up while RAM keeps climbing. On Linux that’s the memory-leak signature from Issue #9094, eventually fixed via PR #9115. You won’t see a crash dialog because the kernel’s OOM killer shoots the process before OrcaSlicer can complain. That OOM is really just the tail end of a freeze: mouse stutters, other apps lag, then OrcaSlicer isn’t there anymore. The fix for that one rarely lives inside OrcaSlicer’s settings.

The four tabs and why “Performance” isn’t one of them
OrcaSlicer 2.3.x ships with four top-level tabs: Prepare, Preview, Device, Project. That’s it. Tutorials telling you to open a Performance or Optimization tab are either about a different slicer or AI-generated. Settings affecting slice speed and stability live inside Prepare’s Process panel.
The GPU is for the preview, not the slicer
This trips people up, including me at first. OrcaSlicer’s GPU runs the preview viewport, not the slicing engine. None of the 2.3.x release notes document any GPU-accelerated slicing feature. When you see nvoglv64.dll in a crash log (like Issue #12142), it’s failing during import or preview rendering, not slice computation. Updating GPU drivers helps viewport stability; it won’t make slicing faster.
First step: find your crash log
Before you try any fix, grab your latest log. OrcaSlicer’s own bug report template publishes the exact paths, and these are the only paths I’ll cite because everything else floating around online is guessed.
Windows
%APPDATA%\OrcaSlicer\log, which expands to C:\Users\<your username>\AppData\Roaming\OrcaSlicer\log. Paste either into File Explorer’s address bar. Most recent dated .log file is what you want.

macOS
$HOME/Library/Application Support/OrcaSlicer/log. Library is hidden, so in Finder press Cmd+Shift+G and paste the path.
Linux
$HOME/.config/OrcaSlicer/log. Toggle hidden files, or cd there from a terminal.
The in-app shortcut
If OrcaSlicer is still running (handy for the freeze pattern where the app is alive but unresponsive), use Help, then Show Configuration Folder. That opens the parent of the log folder, so you’ll see profiles and the log directory side by side. I keep this open during any debugging session. For broader triage flow, the OrcaSlicer troubleshooting master guide covers the wider symptom map.
Fix 1: Windows + Intel E-core crash on complex models (Issue #8227)
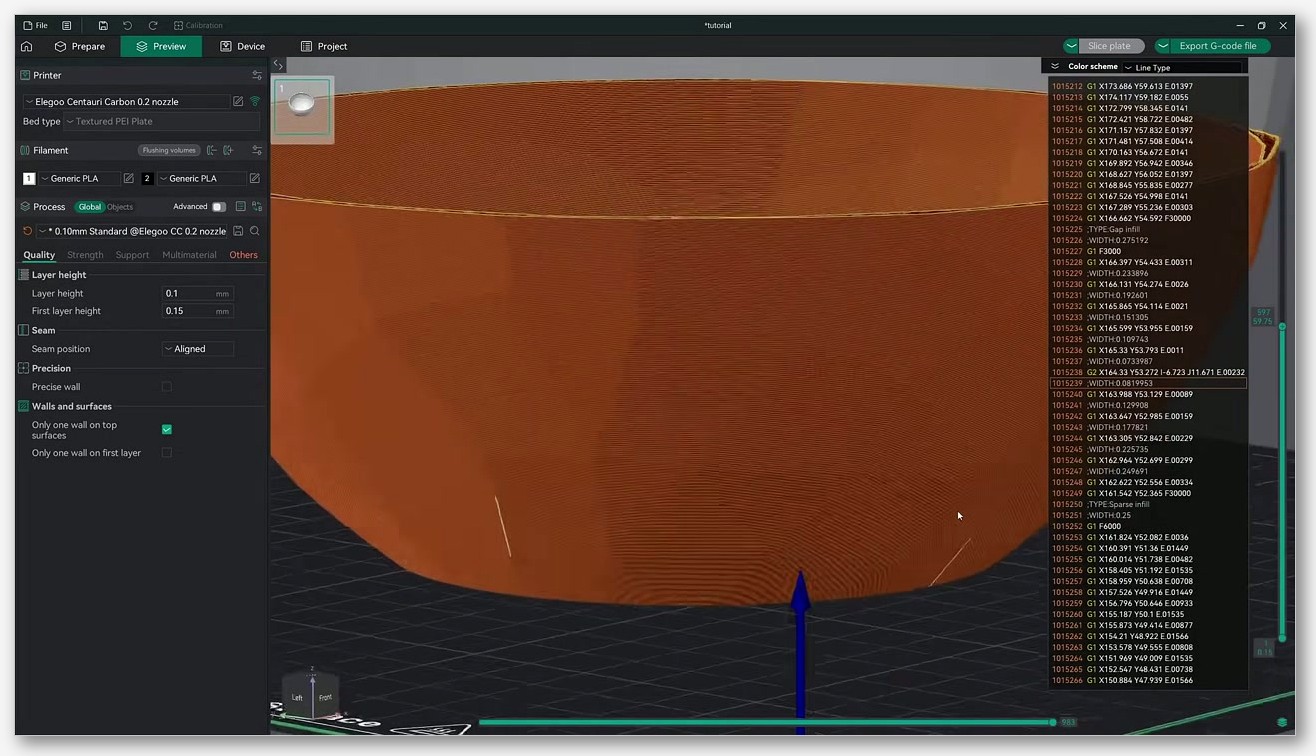
This is the one that cost me my afternoon. Issue #8227 opened 28 January 2025 against OrcaSlicer 2.2.0 on Windows 11 Pro 23H2, Intel i9 13800K with 128GB DDR4 and an RTX 4090. Verbatim: “Orca Slicer will consistently trigger errors and crash when slicing complex models (>500000 triangles) with efficiency cores enabled.” Exception code c0000005, a plain access violation.
Confirm you have an Intel hybrid CPU
The fix only applies on Windows with an Intel 12th-gen or newer hybrid CPU (the ones splitting Performance and Efficiency cores). AMD Ryzen, macOS, and Linux aren’t affected. Press Win+R, type msinfo32, and check the Processor line. Anything like “i5-12600K,” “i7-13700K,” “i9-14900K,” or “Core Ultra 7 155H” means the hybrid scheduler is in play.
Workaround A: Task Manager Set Affinity
This is what I use because it doesn’t need a reboot. Open Task Manager, switch to the Details tab, scroll to orca-slicer.exe, right-click, and choose Set Affinity. Uncheck the boxes for your E-cores (on an i9-13900K that’s CPUs 16 through 31; layouts vary). Leave only P-core threads ticked, click OK, slice again.
Windows resets affinity every launch, so you’ll redo this each time. There are scripted ways around that, including start /affinity in a batch shortcut or process managers like Process Lasso. Issue #8227 only documents the Task Manager path, but the alternatives work the same way under the hood.
Workaround B: disable E-cores in BIOS
Verbatim from the issue: “Disabling e-cores in the BIOS or setting a permanent affinity for Orca Slicer to avoid the e-cores mitigates the problem.” If you don’t care about losing E-core background efficiency, flip the option in your BIOS (on ASUS it’s usually under Advanced or AI Tweaker) and the issue goes away permanently. I wouldn’t do this on a daily-driver laptop, but it’s a clean fix for a dedicated print box.
Why this is not coming as a patch
The issue is closed as not planned. The reporter’s guess, “It seems there is some issue with regards to syncing distributed loads across P vs E cores, maybe it is a timing issue,” lines up with how Windows’ Thread Director hands work between the two core types. The maintainers aren’t shipping a fix, so the workaround is yours to apply.
Fix 2: Linux 75% freeze + OOM (Issue #9094)
Issue #9094 was opened 26 March 2025 on Arch Linux, OrcaSlicer 2.3.0, AMD Ryzen 5 3600 with 31.3 GiB of RAM and a Radeon RX 6750 XT. Verbatim symptom: “Gets stuck at 75% slicing and leaks memory until kernel kills OrcaSlicer.” That’s about as clean a description of a memory leak as you’ll see in a bug tracker.
The signature
If your slice climbs steadily, sticks around 70 to 80 percent, and your RAM usage keeps rising in htop or your system monitor, that’s the pattern. The kernel’s OOM killer eventually fires and OrcaSlicer disappears without any in-app error.
Update past 2.3.0
The fix landed in PR #9115 and shipped in 2.3.1, so confirm you’re not still on 2.3.0. Help, then About shows your version. If you’re behind, grab the latest from the official GitHub releases page. PR #9115 didn’t fix every Linux slicing crash; it was specific to this leak. But it does kill the 75 percent signature for the model class that triggered #9094.
When updating doesn’t help
If you’re on 2.3.1 or 2.3.2 and still hitting it, the surprise about #9094 is that it reproduced on a 31.3 GiB system, so adding RAM probably isn’t your fix either. What does help is closing other heavy apps before slicing, especially CAD like Fusion 360 or SolidWorks. There’s prior art for host slowdowns under CAD competition in Issue #3899.
Fix 3: Windows 11 + 2.3.2 takes 90 seconds to open (Issue #13239)
This one’s relatively fresh. Issue #13239 opened 16 April 2026, OrcaSlicer 2.3.2 on Windows 11 25H2, i7-13700K with 32GB DDR5 and an RTX 4090. Verbatim symptom: “It takes arround 1:30 minutes to open the app and when it opens the home/project screen is empty.” Still open as of writing.
The language-switch workaround
The reporter found one thing that gets the home screen rendering: “If i change the language it works until you close and open again.” Open Preferences, change UI language to anything else, then change it back. Home screen populates. It’s a workaround, not a fix, and the OP is explicit it resets at restart, so you’ll redo it on every launch until there’s a real patch.
Because #13239 is open, more reproduction reports help. If you’re hitting it, post your Windows build (winver), CPU/GPU, OrcaSlicer build, and whether the language trick works. Don’t post a “+1” without details.
Fix 4: Large-file GPU crash on import (Issue #12142)
Issue #12142 opened 2 February 2026 against 2.3.2-dev build f27605e on Windows 11 Pro, build 26100. The hardware is serious: a Quadro RTX A6000 with 48GB of VRAM, a Core Ultra 9 285K, 256GB of DDR5. The trigger was importing a 1.4 GB .STP file and waiting roughly 30 hours before autoscale kicked in and the app died.
The exception signature
The Event Viewer entry: “Faulting application name: orca-slicer.exe, version: 1.0.0.0…Faulting module name: nvoglv64.dll…Exception code: 0xc0000409.” That’s the NVIDIA OpenGL driver throwing a stack buffer overrun. Same kind of signature shows up in big-file CAD viewers and game-engine editors when the GL context gets pushed past what the driver expects.
Pre-decimate before import
The honest fix is to not feed OrcaSlicer a 1.4 GB STP. STEP files carry full B-rep geometry that gets tessellated on import, and the resulting mesh eats VRAM. I convert big STPs to STL in CAD (Fusion 360 has an export-mesh refinement slider; FreeCAD has a similar one), pick a reasonable triangle budget, and import the STL. Skipping autoscale on huge imports is the other half: autoscale is what pushes the GPU context over the edge in #12142.
Update GPU drivers
Worth doing because the crash is in nvoglv64.dll, but remember the GPU only helps preview/viewport, not the slice itself. NVIDIA Studio drivers are calmer than Game Ready for content workloads in my experience. Issue #12142 is still open with no upstream fix.
Fix 5: macOS crashes on slice or launch
Mac users get their own family of bugs, and there are four worth knowing about. For installer hygiene, the macOS install guide walks through the signed release path, which is the trust anchor for almost all of these.
“Error: vector” on Slice Plate (Issue #9743)
Issue #9743 opened 29 May 2025 on macOS 15.3.2, Apple M3 Pro with 18GB RAM. Verbatim: “After clicking ‘Slice Plate’ the first time, an error dialog appears with the word ‘vector’.” Click again and OrcaSlicer dies. Matching log line: [error] ... calc_exclude_triangles:Unable to create exclude triangles. The OP found two reproductions that helped: “Changing layer height to 0.2mm resolved the issue” and “Increasing wall count to 4 allowed successful slicing.” Reproductions, not confirmed fixes (closed as not planned), but cheap to try if you’re stuck.
2.3.2-beta won’t load: missing libzstd.1.dylib (Issue #12306)
Issue #12306, opened 15 February 2026 against the 2.3.2-beta on macOS 26.3, MacBook Air M3 with 8GB RAM. Crash reason: “Library not loaded: /opt/homebrew/_/libzstd.1.dylib.” The /opt/homebrew path is Apple Silicon Homebrew’s prefix, so the issue hits builds compiled via Homebrew or picking up a Homebrew dependency at runtime. Fix: install the signed release artifact from the OrcaSlicer GitHub releases page, or if you need the Homebrew path, run brew install zstd. This was the 2.3.2 beta, not stable 2.3.2.
“Synchronizing device information” timeout (Issue #13165)
Issue #13165 opened 9 April 2026 on macOS 26.4, Apple M1 Pro with 16 GB. Verbatim: “Screen hangs on ‘Synchronizing device information…’ before moving to ‘Synchronizing device information timed out.’ Send job anyway (or dont, it doesnt matter) Crash to desktop.” Still open. Workaround: skip the network-sync send path. Export G-code to a file and load it via SD card or USB.
Draft-shield crash on multiple objects (Issue #10788)
Issue #10788, opened 18 September 2025 on macOS Sequoia 15.7, MacBook Air 2025 with M4 and 24GB RAM. Verbatim: “The program crashes when trying to slice more than a few objects” when each has its own draft shield. OP’s workaround: switch from individual to a combined draft shield. PR #12937 shipped in 2.3.2, so if you’re current you shouldn’t see this. If you’re stuck on 2.3.1, use the combined-shield workaround until you update.
Fix 6: Organic tree supports that look frozen (Issue #9064)
Not every “frozen” slice is a crash. Issue #9064, opened 24 March 2025 and closed as not planned, documented a regression in the organic tree-support generator between 2.2 and 2.3. Verbatim numbers: “OrcaSlicer 2.2 | 3.8 seconds” vs “OrcaSlicer 2.3 | 1 minute 48 seconds” on a laptop, and “2.2 Release: ~2 seconds” vs “2.3-beta through 2.3 Final: ~32-33 seconds” on a desktop.
Switch tree style from Organic to Hybrid or Slim
OrcaSlicer’s tree-support algorithm class is branching. In Process, then Support, if Organic is taking 30 seconds when it used to take two, switch the Tree Style dropdown to Hybrid or Slim. Slightly different support topology, generated in seconds instead of minutes.
 OrcaSlicer slow slicing fix guide covers the slowness side of the line in more detail.
Fix 7: Re-slice slowdown after layer-height change (Issue #9397)
Issue #9397 opened 18 April 2025, closed via PR #7177. Pattern: you slice a triangle-heavy model the first time and CPU sits at 90 to 100 percent for, say, 47 seconds. You bump the layer height and re-slice. CPU now hovers around 20 percent, and the second slice takes “2+ minutes or longer.” The OP’s verbatim workaround, which I’ve used myself: “reloading the project restores normal performance.”
Save, close, reopen
If your slice didn’t crash but feels stuck after changing a setting, don’t keep poking. Save the project (Ctrl+S / Cmd+S), close OrcaSlicer entirely, reopen the project file. Slice goes back to normal speed. PR #7177 helped in current builds, but I still hit echoes after big setting sweeps, and save-close-reopen is faster than waiting out a stuck re-slice every time.
Fix 8: Windows Defender blocks the 2.3.2 installer (Issue #12923)
Issue #12923 opened 24 March 2026 on Windows 11 Pro. Verbatim detection: “Detected: Trojan:Win32/Wacatac.H!ml…This program is dangerous and executes commands from an” attacker. Affected file: OrcaSlicer_Windows_Installer_V2.3.2.exe. The reporter’s own assessment: “This is probably a false positive but wanted to send the details to the devs.”
The Wacatac.H!ml detection
The !ml suffix is Microsoft’s tag for a machine-learning heuristic match, not a signature-based ID. That same heuristic has tagged GitHub CLI installers, Docker Desktop, nw.js builds, and various .NET runtime artifacts. It’s genuinely a pattern, not “Defender is always wrong.” The trust path here is the source of the installer, not the absence of a Defender warning.
Download only from the official OrcaSlicer GitHub releases page
Get your installer from github.com/OrcaSlicer/OrcaSlicer/releases, never from a mirror. The OrcaSlicer safety guide covers the broader trust picture, and the Windows install walkthrough shows where the verified asset lives.
Submit the file to Microsoft as a false positive
Once you’ve confirmed the installer’s hash matches the release (Properties, Digital Signatures, or Get-FileHash in PowerShell), submit it via Microsoft’s security intelligence portal as a false positive. That’s the proper path and it adds upstream pressure to clear the heuristic for the next person.
Diagnosing RAM without inventing minimums
I see this advice everywhere and most of it is fabricated. OrcaSlicer’s README does not publish a minimum RAM spec. There’s no official “4 GB minimum, 8 GB recommended” line anywhere in the project’s docs. So when someone tells you “you just need more RAM,” they’re usually guessing.
The 31.3 GiB system that OOM’d
The single best data point we have is Issue #9094, where the 75 percent freeze + OOM reproduced on a system with 31.3 GiB of RAM. That’s a lot of RAM, so the conclusion is that the bug was a leak in OrcaSlicer’s code, not a “your machine is too small” problem. If a 32 GB system OOM’d, throwing more RAM at it would just delay the same crash.
Close CAD before slicing
What does help in practice is reducing concurrent memory pressure. Close Fusion 360, SolidWorks, Blender, or whatever else you’ve got open before you slice a heavy model. Issue #3899 has documented host-side slowdowns when CAD is competing for resources, and even though that ticket is more about responsiveness than crashes, the same principle reduces the likelihood you’ll hit an OOM cascade.
When to file a bug report
If you’ve worked through the relevant fix above and you’re still crashing, the right next step is to file a useful bug report against the OrcaSlicer repo, not to keep restarting and hoping. The maintainers’ bug_report.yml template tells you exactly what to include.
What the bug template asks for
The template wants OrcaSlicer version, OS and version, hardware (CPU, GPU, RAM), a verbatim description of what you did and what happened, the model file if possible, and the contents of your log folder. Don’t paraphrase; copy and paste.
Pulling the right log lines
Open your log folder, grab the most recent .log, and attach it or paste the last few hundred lines into a code block. Lines right before the crash matter; everything before is startup noise.
Linking your issue to the closest existing ticket
Before opening a new ticket, search existing issues. 75 percent freeze on Linux: comment on #9094. Cylinder/torus 2.3.2 hard crash: that’s #12906. Duplicates get closed fast; comments on open issues get triaged.
FAQ
Why does OrcaSlicer crash only on big models on my new Intel laptop?
Almost certainly Issue #8227 if your CPU is an Intel 12th-gen or newer with E-cores. The crash triggers around models with more than 500,000 triangles. Use the Task Manager Set Affinity workaround to lock OrcaSlicer to P-cores only, or disable E-cores in BIOS for a permanent fix. AMD Ryzen and Apple Silicon are not affected.
Is it safe to disable Intel E-cores in BIOS just for slicing?
Safe, yes. You’ll lose the background-task efficiency that E-cores provide, so multi-tasking with browser tabs, Discord, and so on will hit your P-cores harder. For a machine you mostly use for slicing it’s fine. For a daily-driver laptop you’d probably rather use the Task Manager affinity workaround per session.
Why does my slice get to 75% then crash my whole machine on Linux?
That’s the Issue #9094 leak signature. Update to OrcaSlicer 2.3.1 or later so you have PR #9115, and if you’re already on 2.3.2 and still hitting it, close other heavy apps before slicing. Note that more RAM probably won’t fix it because the original report happened on a 31.3 GiB system.
Will more RAM stop OrcaSlicer from crashing?
Probably not. OrcaSlicer’s README doesn’t publish a RAM minimum, and the documented OOM in #9094 happened on a 31.3 GiB system. If you’re crashing it’s almost certainly a specific bug pattern (E-cores, GPU driver, leak), not a “not enough RAM” problem. Diagnose the symptom first.
Does updating my GPU driver make slicing more stable?
It can help with import and preview stability, especially the nvoglv64.dll exception class in Issue #12142. It will not make the slice computation itself faster, because OrcaSlicer doesn’t GPU-accelerate slicing. The GPU is for the preview viewport only.
Is the Windows Defender warning on the 2.3.2 installer real?
It’s a known false positive per Issue #12923. The detection is Trojan:Win32/Wacatac.H!ml, where the !ml suffix means Microsoft’s ML heuristic flagged it. That same heuristic has hit GitHub CLI, Docker Desktop, and other legit installers. Trust the source: only download the installer from the official OrcaSlicer GitHub releases page, and submit the file to Microsoft as a false positive.
Where exactly are the crash logs on my OS?
Windows: %APPDATA%\OrcaSlicer\log. macOS: $HOME/Library/Application Support/OrcaSlicer/log. Linux: $HOME/.config/OrcaSlicer/log. Or use Help, then Show Configuration Folder inside OrcaSlicer to jump straight there.
“OrcaSlicer crashes” isn’t really one bug, it’s eight (or more) different bugs that all happen to make the window vanish. Walk through the list above, match your platform and symptom, and you’ll usually land on the right fix within twenty minutes. If you don’t, the log path is your next move, not a forum post. For the other side of the diagnostic flow, the slow-slicing fix guide covers slowness as distinct from crashing.
Related OrcaSlicer guides
- OrcaSlicer Troubleshooting: Master Index of Every Common Fix
- OrcaSlicer Layer Shifts: Causes, Diagnostics, Fixes (2026)
- OrcaSlicer Under-Extrusion: Diagnosis & Real Fixes (2026)
- OrcaSlicer Over-Extrusion, Blobs & Zits: How to Fix Them (2026)
- How Often Should You Recalibrate OrcaSlicer? 2026 Maintenance Schedule